2018 Fall Game Project – Cards

Fall semester of my Junior year at Virginia Tech was more a laid-back one when compared to my earlier semesters – mainly due to the fact that I was a year ahead of schedule and most, if not all, of my hard classes were behind me. I took the solid amount of free time that I had to start researching new and interesting computer science topics, while building on the skills I had learned previously either at my internship with Cox, or through the work I had done by myself. After coming up with a couple of different ideas, I settled on a basic card game, twisted in such a way as to challenge what I knew and force me to learn some new and interesting concepts.

Essentially, my goal was to create a multiplayer standard 52 card game that was able to support any rules the players decided to enforce. The idea was to create a simple backend so that I could have the liberty on focusing on the more challenging and new concepts like communicating with a central game server. I also wanted to test my abilities in making a backend in C, as it is well known that lower level languages, like C and C++, are great for games due to their relatively fast execution times. However, making all other aspects of a game in C (i.e. rendering) can be rather frustrating and time consuming, so I also decided to code the frontend in another language. As such, I settled on python/pygame. Finally, as I wanted to make the game multiplayer, I needed to include a server framework that was able to communicate with n many clients at a time, while still being able to interface with the backend C code. After doing some research, I decided on ASP.NET, as I am generally unfamiliar with C# and the .NET framework, and wanted to use the opportunity to learn something new instead of falling back on a framework I’m more comfortable with. Using C# also allowed me to interface with the backend incredibly easily (detailed later). I decided to upload the server on AWS/EC2, as I’m always looking for an excuse to learn more about the Cloud/AWS and practice using it.

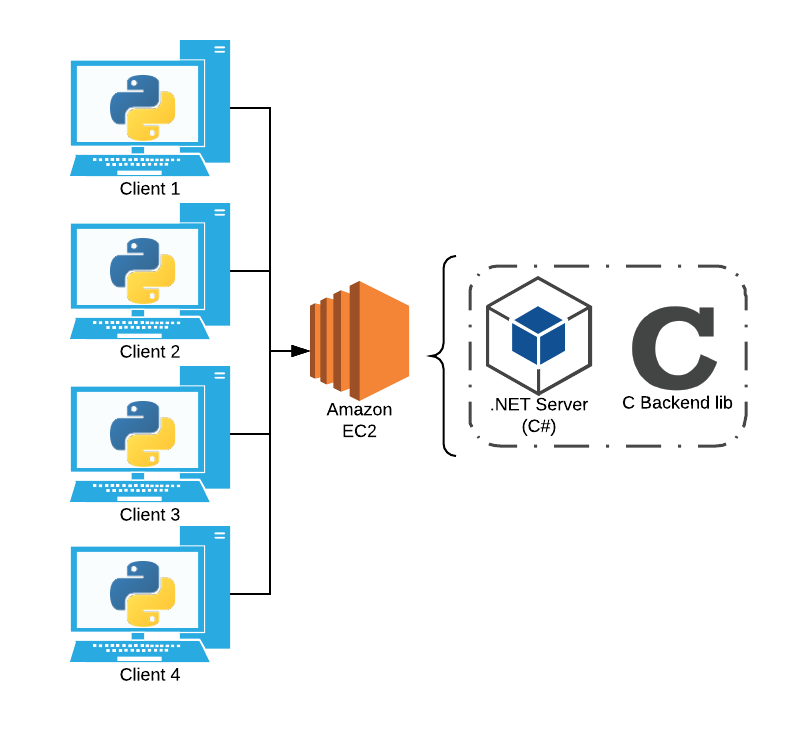
The final architecture of the card game project.

Coding the C backend was the easiest part of the project – mainly due to my comfort level with the language (thanks to the many difficult low-level programming courses taught by Virginia Tech), but also due to the nature of the project. The game is fairly simple; there exists only a couple of noteworthy objects/data structures. The main deck, the cards on the table, and the cards in each of the player’s hands. All of these objects can be represented as a Deck, each containing Cards. I created the Deck data structure as a hybrid between a stack and an array list. It supports popping and pushing, as drawing from a deck usually entails popping from one deck and pushing it onto another, but the need for placing or picking cards from specific indices was also necessary, as a player picks and chooses specific cards to move onto or into their hand from the table. As of right now, the backend supports 4 basic functions – drawing from the main deck to the table, drawing from the main deck to a player’s hand, picking a card up from the table and placing it into a player’s hand, and placing a card from a player’s hand onto the table. Keeping it relatively simple, at least for the time being, allowed me to write up this portion of the project quickly and move on to the newer and more challenging parts of this project. I definitely plan on revisiting this section and fleshing it out to add more functionality later down the line.

Next came creating the server and wrapper for the backend. Like I stated before, however, this was relatively easy, as the choice for C# made interfacing the C backend easy (through DllImport) and the .NET framework allowed for a speedy standing-up of a basic RESTful web API (through MVC). Essentially, the client makes requests on various endpoints depending on the method they want to invoke. All I really had to do was create endpoints for each of the 4 functions described in the paragraph above. Other than that, I created register/unregister endpoints for when a player joins or leaves the session (mainly to ensure that the number of players didn’t exceed the maximum of 4, and to assign each player a specific player id), and basic start/terminate endpoints. After creating the C# server, all that was left was to publish it on an AWS EC2 instance, which admittedly took some time as I was unfamiliar with how to do so, but was achievable in the end after some time and googling.

Finally came creating the frontend in Python. Thankfully, interfacing the server was relatively easy due to the urllib library. As a result, I really just needed to focus on getting the correct information from the server and translating it into something that could be easily understood and rendered using pygame. I achieved this by adding an endpoint to the server that retrieved a JSON object of the entire table (including the main deck, the cards on the table, and each of the hands). The python code regularly makes checks to this endpoint and references it against a stored version. If they differ, the local versions of these decks are changed to reflect the differences. All I really needed to do at that point was render the cards and come up with an intuitive way to activate the backend functions. I took inspiration from the popular online card game Hearthstone and implemented a dragging feature, where players can click and drag cards from their hand to the table or visa-versa.

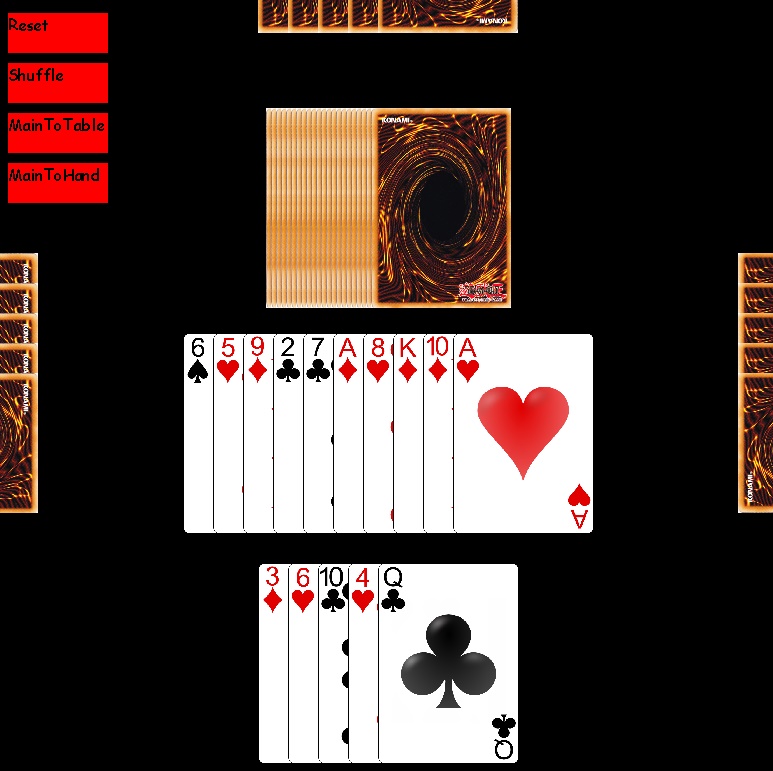
The current status of the python client, with 4 players connected to the central server. You can see the main deck represented in the middle of the screen as the stack of non-visible cards, and the on table cards represented as the stack of visible cards. Each of the hands are also present, with only the current player’s hand being visible.

I still have much I want to achieve with this project. After an initial play test with friends we discussed a couple of features that would be good to include later down the line. For instance, the ability to show cards from one’s hand without having to place it on the table, being able to discretely trade cards between players, and the inclusion of a discard pile. I’m eager to continue optimizing and working on this to see where I am able to take the final product. If you’d like to see the code for this project, you can view it on github here.

Thanks for reading! If you have any questions or comments, feel free to write them below or email me at [email protected].


2018 Summer Build/Arduino Project – Pump It Up Dance Pad

Recently, through influence of friends and a bit of chance, I’ve become interested in the dance game Pump it Up (PIU). For those who don’t know what it is,  PIU (owned by Andamiro) is essentially a Korean version of Konami’s Dance Dance Revolution, with arrows in the corners and middle instead of the cardinal directions. You’ll likely find machines for the game at local arcades, with several big names (i.e. D&B) supporting the brand as well.


A Pump it Up: Prime 2 machine (most recent iteration).

As the closest machine is 45 minutes away from where I’m staying at Virginia Tech next year (and honestly 30 minutes away from my house in Atlanta on a good day), I decided to try my hand at building my own dance pad to hook up with a computer and play with StepF2, a mod for Stepmania that emulates a version of PIU. Plus, the market for professionally made pads is somewhat barren, meaning I’d have to wait for quite a bit and spend a small fortune if I wanted to buy a decent pad instead of building my own. Decent pads can be anywhere from $300-500 depending on manufacturer. I was able to build mine for about $175-200, saving a fair bit of money.

First came deciding on what materials I wanted to use for the build. I wanted this to be fairly lightweight to ease portability (mainly from home to school) but also look decent. Eventually I just settled on 1/2″ plywood for base/support and 1/4″ birch sheets to use for the pads and pad platforms. I tried to stay as true to the original dimensions of the pad as possible, which resulted in overall dimensions of 35″x35″x1″ (which just barely fits in the trunk of my 2006 Prius, let me just add). To add a layer of protection (for both the wood and the feet of those who are playing), the top is covered in a layer of 1/32″ polycarbonate plastic. Other than that, I ended up using an 8mm (just over 1/4″) high density foam to act as a spring for the pad (mechanism will be explained later) and some Cat5 to wire everything up. An Arduino Leonardo was used as the computer (chosen over other options due to its ability to be plugged into a computer and function as a keyboard).

First came building the frame. The entirety of the pad is rested on a sheet of 35″x35″x1/2″ plywood acting as a base, with 1″ strips of 1/2″ plywood going around the sides of the base to act as a frame. Again, 1/2″ plywood was used as spacers between the pads which resulted in a sort of frame for each pad.The completed frame.

Next came designing the mechanism for the pressure sensors to determine when the pad is pressed. The mechanism is simple and rather easy to understand. Essentially, underneath each 1/4″ pad is a 1/4″ platform with a sheet of interlocking foil on it acting as a conductor (2 separate halves). One of these halves is connected to power and the other is connected to a corresponding pin on the Arduino. Underneath the pad itself is a single strip of aluminum. When the pad is pressed, the strip underneath the pad itself connects the two halves of aluminum sheet, completing the circuit and causing a change of state for the pin on the Arduino. High density foam was laid around the platform (there is an inch space between the platform and 1/2″ support piece) and functioned as a sort of spring mechanism to keep the pad above the sheet in its natural state. Cat 5 was used to wire everything together, with heavy duty staples being used to fasten it in place with the aluminum and hot glue elsewhere.


The sensor mechanism of each pad. You can see the interlocking pattern of aluminum present. A single pad is shown at the top of the pad to demonstrate what the connecting sheet looks like.

The software side of this project is incredibly simple. Each of the 5 pads is assigned a pin on the Arduino Leonardo and whenever a change in state is observed, a signal is sent to the connected keyboard that signifies either a key press or release on a keyboard. This mapping is then mirrored on StepF2’s key settings to complete the setup. If you want to see this code for yourself or want any tips/pointers, feel free to email me.

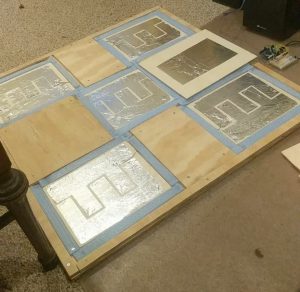
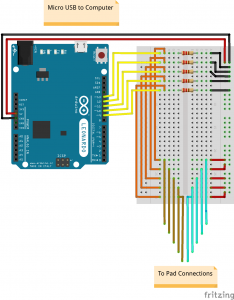
The Arduino circuit for this build. It’s set up in such a way that the pins read low when the pad is not engaged and high when engaged. 

For the finish, I coated the frame and top half of the pads in a layer of black spray paint. I traced a set of PIU arrows I found online, sized them correctly, and had them professionally printed and laminated. On top of the frame is the 1/32″ layer of polycarbonate mentioned earlier, of which was easy to work with and functions just fine. The added layer of polycarbonate keeps the pads themselves from wiggling too much, a problem that was present in an earlier stage of the build (another work around for this would be to glue the pads to the foam, but I like the idea of being able to take the pad off in case one of the sensors becomes unresponsive or some other error occurs). I’m incredibly pleased with the final look and feel of the pad overall.

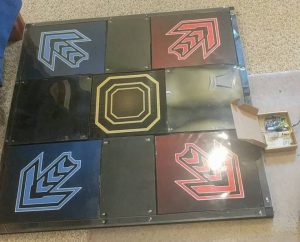
The final version of the pad. You can see the Arduino hooked up at the top of the pad. As of right now, I’m just using a cardboard box to house everything

This was an incredibly fun way to spend about a week of my time and I’m definitely satisfied with the result. I still have some tinkering around with the sensitivity of the sensors, but that’s a gradual process that doesn’t require too much effort on my end. The pad works and plays as expected. As for things I would change if I were to do this build again, I would have rather used a CNC laser cutter instead of a table saw to do all the cutting, as I found out quickly that even with double and triple checked measurements, some cuts are just bound to be inaccurate (especially for someone like me who isn’t too familiar with carpentry or work like this in general). Luckily, it didn’t turn out to be that big of an issue. Other than that, I think I should have used a roller/more traditional paint instead of spray paint, as it was hard to keep the layers even across the entirety of the 35″x35″ pad.

Thanks for reading! If you have any questions or comments, feel free to email me at [email protected].

2018 Summer AWS Project – WordPress Hosted Through AWS

My summer of 2018 was spent interning with Cox Automotive (Atlanta) on the Enterprise Data Platform (EDP) team. Put simply, the EDP application serves as a managed data lake hosted through various AWS services. As I had previously no experience with AWS or Terraform, the language Cox uses to build infrastructure on AWS, I thought it would be fun and informative to go off on my own and play around with both subjects.

Honestly I’m surprised I waited this long to look into AWS. It’s really been blowing up in the tech world for a while now, and they continue to add new services on a regular basis. At this point they have over 50 services available to build any cloud application you could think of, from Cox’s interest in a managed data lake, to my interest in hosting a website. My original plan involved hosting the website out of an S3 bucket, but was eventually changed once I decided to stay with WordPress. I was rather surprised at how easy it was to set everything up manually – all that was required was an EC2 instance running a pre-defined image specifically used for WordPress (and a Route 53 entry pointing the domain name to the EC2 instance). Once up and running, it was simple enough to ssh into the instance and play around with the settings to get it the way I wanted (i.e. adding SSL/https support).

The original plan. It involved routing the domain using Route 53 through Cloudfront (for https) and to an S3 bucket hosting html files.

The final implementation. Instead of routing through Cloudfront and then to S3, it was routed directly to an EC2 instance running WordPress with LEGO (Let’s Encrypt) for SSL/https.

After settling on a routing strategy came building the infrastructure in terraform. For those unfamiliar with terraform, it’s used specifically for building/deploying to different cloud environments quickly and easily. It’s coded in HCL (Hashicorp Language) which is essentially a more human-friendly version of JSON. As a result of AWS’s convenient endpoint setup, its incredibly easy to link services together. After successfully deploying, all that was then required was setting up SSL/https. For this, I just used a free certificate service called LEGO.

This project was equally informative as to the kind of work I would be doing at Cox as it was fun to poke around all of the different services provided by Amazon. If you’d like to see the terraform code referenced to in this post, you can find it here.

2018 Winter Data Analytics Competition – MCM

I took a brief break from working on side projects to participate in the MCM (Mathematical Contest in Modeling) competition. I decided to compete in this competition mainly after enjoying and seeing success in the previous semester’s GDMS data analytics competition (post linked here) in which my team received an honorable mention in the beginner’s division. Again, my team consisted of friends Kali Liang (CMDA major) and Eric Fu (BIT major). Looking back on both of these competitions, I would definitely say the diversity in majors really helped in our ability to come together and perform, mainly due to our differences in perspective when it came to looking at the problem as a whole. Similar to the previous competition, we were given a .csv file with about 600 categories involving energy consumption and production rates per year in Arizona, California, New Mexico, and Texas, and were asked to come up with energy profiles for each state and to predict energy consumption and production in 2025 and 2050, all in the context of using cleaner energy sources. For reference, we tackled problem C (all problems linked here).

We used a mixture of VBA (Excel), Python, and R to analyze the given data. My main job was to determine which subsets of data were interesting and useful and to plot them using Python/matplotlib.

Moving on to the actual data analysis, we started by creating energy profiles for each of the four given states. We split our profiles into 3 graphs we deemed relevant, including overall energy consumption, overall energy production, and energy usage by sector in each state. The main hurdle for this section was deciding how to cut down the data to where each graph wouldn’t be too cluttered but the data would still be accurate enough to use. For instance, for energy consumption alone, each state’s initial graph had over 20 sub-plots, making the graph hard to read at first glance. This was due to the inclusion of ultimately insignificant values (for instance wood and waste energy consumption). As a result, we cut these insignificant sub-sets, facilitating visual analysis on each graph. The downside to this was not having a fully accurate representation of total consumption and production in each state, but we decided the sacrifice was worth it for the visual clarity provided. az_profile_cons.png
Energy consumption graph for Arizona. You can see that as the Y values approach 0, the higher the concentration of plot points (and this is after cutting more than 10 sub-sets).

Next, we moved onto attempting to define a more accurate illustration of the data set in regards to the context of the problem, renewable energy usage. We decided the best way to do this was to put everything in terms of the estimated amount of pollution each state was producing per year. We determined this value for each state per year by calculating the summation of each states energy consumption value multiplied by the transfer rate between that specific energy type and CO2 emissions. Essentially, we arranged Jet Fuel, Natural Gas, Coal, Petroleum, Motor Gasoline, and LPG consumptions per year in a single-column matrix and found its dot product with a constant single-column matrix that consisted of the conversion coefficients for that specific energy type and CO2 emissions, labeled C in the graphic below. We determined the conversion coefficients by pulling data from the EIA (here).

Screen Shot 2018-02-19 at 2.08.00 PM.png

Screen Shot 2018-02-19 at 2.09.34 PM.png
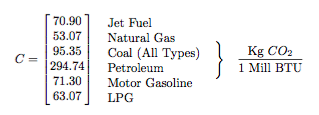
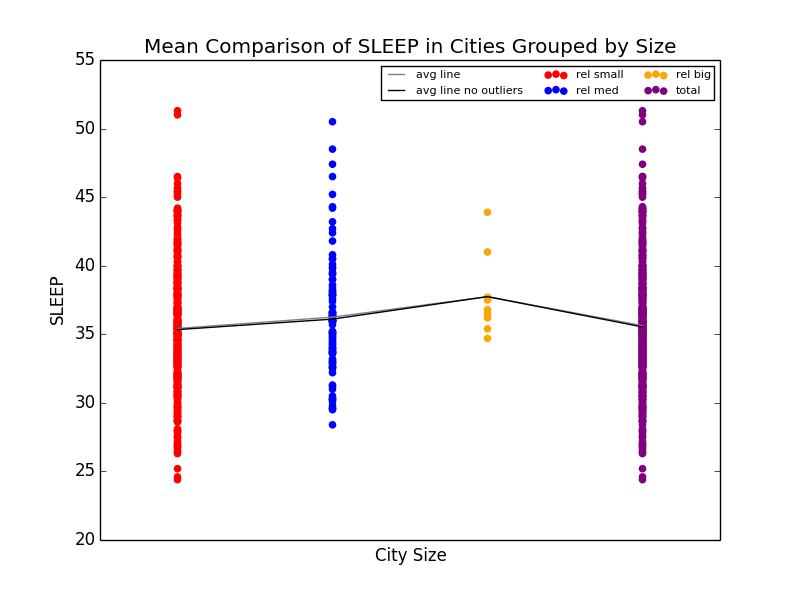
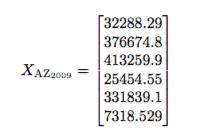
Excerpt from our final paper detailing the values of the C conversion constant and giving Arizona’s numbers for 2009.

Using the information above (Note: the structure of X_AZ follows that of C (in order of energy type from top to bottom, given in billion BTU. A conversion factor of 1000 Mill BTU / 1 Bill BTU was added) we are able to calculate an estimation of the CO2 emissions in Arizona in 2009 (X_AZ_2009 * C = 93307874.83 metric tons of CO2. Given the population of Arizona in 2009, we can then determine an estimation of CO2 emissions per capita of Arizona in 2009 (abt. 14 metric tons of C02 per capita). We then generalized this process in order to create a graph of CO2 emissions in each state per year.

total_c02_capita.png
Graph detailing CO2 emissions per capita per year in each of the states. We used this information to generally rank each state in terms of pollution production, in order to circle back and create a discussion surrounding using cleaner energy sources.

Next came predicting energy consumption/production in 2025 in the context of cleaner energy usage. For this, as we began to run out of time (we only had four days for this competition) we resorted to using a basic linear regression to predict the values for 2025 and 2050. The main notable conclusion from this experiment was seeing how high energy consumption values were predicted to become, especially in regards to the very rapidly increasing CO2 emissions per capita for each state. As an example, total energy consumption in Arizona, using the linear regression model, was projected to increase by over 800,000 BTU. This, paired with the estimated increase in CO2 emissions per capita of abt. 5 metric tons per capita shows just how quickly pollution is projected to get out of control. Of the four states, Texas had the worst CO2 emission rates per capita estimated by 2050, seeing an increase of 37 metric tons per capita from 2009 (a projected value of abt 76 metric tons per capita). Again, we used these values to stress the importance of switching to more renewable energy sources in the coming years, before damage becomes irreversible.

Using all of the above data, we discussed in our conclusion the importance of moving away from commonly-used, bad for the environment energy sources. With the exponential increase in population in all of these states and really throughout the world, energy consumption and production has understandably seen a drastic increase in recent years. However, with the threat of global warming, each state needs to do whatever it can in order to slow or even reverse the effects brought on by these increased consumption and production rates.

I’m incredibly thankful to have competed in the GDMS competition prior to this competition, because without prior experience, we definitely would have had no idea where to start and probably would not have finished on time (of which we only barely did given the work detailed above, after making a numerous amount of assumptions ultimately weakening our argument). All in all, this competition was equally taxing on our mental health as it was fun to compete in. We look forward to participating in future data analysis competitions in the future. Unfortunately, we don’t hear back about the results until some time in April. If you want to see our final paper (written in LaTeX) in detail, you can find it here.

2018 Winter AI Project – Connect 5 Minimax

After finishing my previous project, I still found myself with plenty of time in-between classes (thankfully I’m only taking 4 courses this semester as opposed to my usual 6, so hopefully this trend continues throughout the semester). Also, as I recently took up a UTA position for CS2505 at VT (Intro to Comp Org), I found myself with plenty of down time on-shift as the early assignments are easy and most students don’t need help as of yet. Thankfully, some friends come and spend time with me to make the time go by faster. One of these friends typically brings a Go board along with her and loves to play connect 5 with us (think tic-tac-toe, but on a Go board, and you have to connect 5 instead of 3). After countless games, I thought back to my minimax algorithm for tic-tac-toe (here), and wondered if it applied smoothly to connect 5. And so, I decided to start working on this project.

First was to create the game. I was drawn to Java because I’m most comfortable working with object-heavy projects in Java (as opposed to something like Python). Coding the basic game was simple. The board itself is basically an 18×18 tic-tac-toe board. As such, I just used a 2D integer array size 18×18 and used constants for black, white, and empty spaces. I used swing for rendering, and KeyListeners for user input. Arrow keys navigate and enter places a piece. Upon placing a piece, control is handed over to the AI to decide the move they are going to take.

Screen Shot 2018-02-05 at 2.24.53 PM.png
Empty gameboard. The cursor is indicated with the red square (moves with arrow key input). As you’ll see later, the blue cursor (not shown here) indicates the previous move.

Next came calculating the heuristics for scoring any given board. I used this post by Ofek Gila as a foundation and built on that. Essentially, the board is traversed in every direction (horizontal, vertical, topleft->bottomright diagonal, topright->bottomleft diagonal) and consecutive pieces are counted and scored, with the sum total being the overall score of the current board state. The scores for consecutive pieces are based on the perceived value of that shape (i.e. a 5 in a row is worth much more than a single piece). I wanted this version to play very defensively (an annoying strategy for veterans of the game), so there are noticeable score differences based on what the color of the consecutive pieces is. Afterward, I began writing the minimax algorithm. The basic jist of minimax is to look a set number of moves into the future, score the current board state, and play off of the assumption that your opponent is going to make the best move for them at their given board state (hence the name minimax — you’re trying to maximize your gains and the opponent is trying to minimize them). I settled on looking 2 moves into the future, as it fit the balance of running quickly and decent decision making. If you want to learn more about minimax, feel free to look at the code for this project (link at the bottom).

Screen Shot 2018-02-05 at 2.23.14 PM.png
Using minimax, the AI (white) was able to defeat the user (black) here, while also stopping a win for black (if the white piece at the upper-right was not placed, black would have won)

Using this method, I ran into a couple of speed bumps. The major issue was performance. Especially at the beginning of the game, even after the user’s move, there are still 323 possible moves (18^2=324, -1 for the placed piece). That in addition to looking n moves into the future, meant that there are about 323^n checks that the algorithm needs to make (the number is actually slightly less than 323^n, as it doesn’t factor in placing new pieces and repeating the process, but it is essentially that value for small values of n, so we will ignore it for this basic analysis). To solve this, I cropped the board down to only ‘relevant’ spaces (I defined relevant here as any space around all of the current pieces in play with a buffer of 2 spaces on every side). Using this method, I was able to reduce the number of checks for 2 moves from 323^2=104,329 to 25^2=625 (placing one piece and creating a buffer of size 2 on every side creates a 5×5 grid, resulting in the 25 seen there (5^2 = 25)). Other than that, there is a bug in which the AI would let the player win if it won later down the decision-tree (in other words, it detected a win but didn’t take into account the opponent winning sooner). I expect this to be an error with scoring, but as I want to continue working on other projects, I will leave this bug in for now.

Screen Shot 2018-02-05 at 2.21.13 PM.png
You can see that the AI (white) detected a win, so it ignored black’s 3 in a row, ensuring a win for black.

Testing this out on some of my friends, I found that it played fairly decently. However, due to some minor bugs in the score evaluation (detailed at the end of the previous paragraph), veterans could consistently beat the bot (albeit after hard, long-fought games). This project was a fun one that I could share with friends, so I definitely enjoyed working on it and seeing it get better along the way. I encourage you to download the project and try playing against it yourself. You can find the github for this project here.

2018 Winter Web Project – Pyreddit

During the start of my spring semester, I found myself with a lot of free time while waiting for classes to pick up in difficulty. I thought of side projects to do to fill up this time, and decided to focus on something web-based, as the last time I did anything web related was in highschool. Eventually, I ended up finding projects like rtv, of which inspired me to create something of a reddit browser from terminal. Upon doing a bit of research, I found that there exists a nice, easy to use library that handles connecting to reddit in python called praw. I mainly focused on browsing, not submitting jobs (like upvoting or writing a post), simply because I focused on my own reddit-using habits. I mainly read posts, and rarely (if ever) make them, so I decided to cut that feature from my program. Perhaps if I come back to this in the future, I will implement those features.

Thanks to praw, connecting to reddit was very easy. Given some credentials (along with authorization codes for a script to connect to reddit), I was able to connect in essentially just one line. Praw allows easy movement within reddit as well, whether it be connecting to different subreddits or posts within a subreddit, its all very easy and straightforward. If you’re considering making any script or application that will connect to reddit, I strongly recommend praw. View connection_manager.py (github linked below) to see for yourself how easy everything really was.

Screen Shot 2018-01-23 at 3.00.49 PM.png
All of the setup for pyreddit occurs within less than a second, and is easy to implement from a developer’s point of view.

Other than establishing a connection, all that was left was figuring out how I wanted to do the user interface. I used the colorama library to color text, and used reddit’s basic layout as inspiration for the various aspects that needed a ui. First off was subreddits. Praw loads in an iterator for a large number of posts from a given subreddit and tab (hot, top, new, etc.) so all I needed to do was separate those into pages.

Screen Shot 2018-01-23 at 3.03.40 PM.png
Cutout of a page in pyreddit. I tried to make each bit of information color-coded to ease user understanding. If the user wants to open one of these posts, they simply have to type ‘open i‘, where i is the index of the post (shown in red in the screen).

Next was creating an interface for posts. I created a simple method for breaking text bodies into chunks that were easy to read (split the post body at the space after 100 characters from the previous split) and created comment trees similar to that of python using depth-first search. All of which resulted in a simple, clean style that doesn’t look too bad. I used the webbrowser library (standard in python) to open the current post’s url if so desired as well.

Screen Shot 2018-01-23 at 3.10.37 PM.png
Example of a post shown within pyreddit. If the post itself contains a body, it is printed in the same fashion (split every 100 characters at a space, etc.)

This was a quick and easy project that helped me further my understanding in python scripting and establishing web connections (esp. to reddit). If you want to download this program or look at the code, you can find the github for this project here.

2017 Fall Cluster Project – Raspberry Pi 3 Cluster

After using VT’s cluster for so long, I was interested to learn how the computing behind it worked, and decided to make my own cluster of Raspberry Pis. I contemplated the benefits of embarking on such a project and came up with a multitude of experiments I was interested in exploring that would benefit a cluster-like structure, of which include password decryption, simulation for genetic algorithms, and more. What really tipped me over, however, was the already written and free to use libraries MPI and MPI4PY, of which allowed me to use python to write easy to understand and easy to implement code that utilized cluster computing. Thankfully I had a lot of the components on hand already, but I estimate the overall cost to be around $270. This includes the cost of 4 Raspberry Pis, 4 8gb micro SD cards, a stand for the pis, an ethernet switch, 5 ethernet cords, a USB hub, and 4 micro USB – USB cords. There’s a great video series by Tinkernut on Youtube that I used for basic reference when configuring my Pis that I’d certainly recommend you follow along as well if you have any difficulties putting one of these together. If you have any questions about any of the components I used to build my cluster, feel free to email me at [email protected].

For my cluster, I used 4 Raspberry Pi 3 B boards, each running a distribution of CentOS 7 Linux. I decided to use CentOS 7 over a friendlier version of linux (i.e. Raspbian, a distribution written specifically for the Pi), simply because VT’s cluster also uses CentOS. Each Pi is given power and connected to an Ethernet switch that is also connected to my router so I can ssh into each of the nodes.

23846287_1514413558653154_1522017645_n.jpg
Picture of my cluster

I have the Pis set up in a master-slave system, in which the head node takes one big problem and divides it into smaller problems for the slave nodes to compute. This allows me to, say, run genetic algorithm/ANN simulations on the slave nodes while performing breeding and fitness evaluation on the master node. I definitely plan on experimenting with speedups in regards to AI in the future, so be on the lookout.

After building my cluster, I found it fitting to at least write a short piece of test code to see how much the cluster structure sped things up. I decided to time Leibniz’s Pi approximation to the 100,000th term on a single worker vs. all three workers. You can see the results of that experiment below.

Screen Shot 2017-11-22 at 9.04.51 PM
Testing 1 vs. 3 workers

You can see that the test in which I only used one worker (nodelist_small), the runtime was approximately 3 times as large as the runtime when I used 3 workers (nodelist), which is to be expected. You can also see that the estimates are slightly different, though I believe this error to be a result of integer division losing some information when divvying up the work for slave nodes (As this is just a small test, I’m leaving this error for now). You can get the code for this test here.

This was an incredibly fun and practical project to work on during my Thanksgiving break. Definitely be looking for more updates from me as I begin to experiment more with the cluster and what it can do. Hopefully I can run some experiments before my next break, but as exam season is coming up, I may need to focus more on my studies. If you have any questions or comments, feel free to email me or leave a comment.

When idle, my cluster is aiding the BOINC sponsored SETI@Home project. I chose this over other BOINC projects mainly due to it’s friendliness towards ARM processors (of which the Raspberry Pi uses).

2017 Fall Data Analytics Competition – VT/GDMS Health in the US

Moving into the fall semester of my Sophomore year at Virginia Tech, I was a little starved of side projects I could do, simply due to the amount of schoolwork I had to finish each week. However, luckily I was able to make time for a couple projects I could focus on in the side. One of them being is data analytics competition, of which was sponsored by the CMDA club here at VT and GDMS. I participated in the beginners competition in a group of 3, the other members being good friends of mine Eric Fu and Kali Liang. In the competition, we were given a large data set (.csv file) involving health issues across various cities throughout the United States (500 entries). Some examples of the categories, just to get a feel of the type of data we received, included ailments such as asthma, obesity, heart disease, kidney disease, etc. We were also given general data involving disease prevention (i.e. access to health care, going to regular checkups, etc.) and unhealthy behaviors (i.e. binge drinking, drug use, lack of leisure time and sleep, etc.).

I believe that my group’s approach to the data was a rather unique one, given our different backgrounds. Eric is a BIT major, Kali is a CMDA (Computational Modeling and Data Analytics) and Statistics major, and I am, of course, a Computer Science major. As a result of our different backgrounds, we each had different ideas as to how to approach the information to find correlations between the categories. For instance, my approach was to code basic programs in Python using numpy and matplotlib to generate scatterplots and other useful graphs, while Kali was comfortable using R to find more statistics-heavy information (like GLM/LS Means) and Eric was comfortable working directly in the given Excel file to look for correlations.

First, we decided as a group to look for interesting differences in the data by splitting the it up into regions. We explored a number of splits, and we ended up using data from a regional split (NE, S, MW, W), a coastal split (west/east coast, with everything else being lumped into a “main land” group), and a split based on population size to explore the uniqueness of big cities (we defined a big city as any city above 2 standard deviations above the mean population for the entire data set). We also explored a split based on State, but found the data to be too volatile, and with 51 groups (incl. Washington DC), there were still too many points to investigate. My python scripts came into good use here, as I was able to make a quick program that found and graphed the scatterplots of each region for any given category, along with a line that connected the means for each sub group together (with and without outliers) for visual investigation. I also coded a script that plotted scatter plots for any 2 given categories to see if they were related.

OBESITY.pngOBESITY.png

The first graph details the difference in Obesity in the east vs. west coast, while the second illustrates the difference in Obesity in the US Regions.

From this initial stab at the data, we found what we believed to be significant differences between the general health in the east coast and the west coast (meaning the west coast was significantly lower than the east in almost all categories). Also worth noting, we also determined that health in the west region was generally better than the other regions. From this lead, we explored the differences in the means to attempt to understand why the west is generally healthier. We observed that both the west coast and the west region have significantly lower Obesity rates when compared to other regions, and decided to explore that as a possibility (see the mean comparison charts above). We confirmed our assumption by looking at the general trends for obesity and various other ailments and observed that, in general, there is a strong link between obesity and other serious health problems.

figure_1.pngfigure_1.png

Some of the scatterplots we used to illustrate the link between Obesity and other serious illnesses like heart disease (CHD) and asthma (CASTHMA). 

In order to further provide evidence for our assumptions, Kali used regression analysis, specifically generalized linear models with least square means to further look for significance between these groups. Using these tests was helpful because it not only aided at eliminating some of the confounding variables that may be lurking within the data, but made it extremely clear as to whether the data was significant or not through looking at the p-value numerically and with a visual aide. Essentially, when graphed, intervals of the mean are plotted for each region (each interval determined using a 95% CI). If the regions don’t have any overlapping points, then the difference between the two can be considered significant and is definitely worth looking into. As you can see below, we were able to confirm our assumption that the difference between obesity rates in the east and west is significant.

Picture1.png

LSM Chart confirming our assumption that the difference in Obesity rates in the east and west coasts is significant

However, we were not satisfied simply stating that we recommend that Obesity rates be lowered, so we looked into possible variables that could affect Obesity that weren’t already included in our data set. Ideas for this included finding density of fast food restaurants within each city, and measuring the nutritional differences between each city. Unfortunately, we were unable to find any reliable data on density of fast food restaurants, but we were able to pull data from the CDC website pertaining to amount of people that ate less than one fruit and one vegetable per state in the US. Using this data, we first confirmed the link between not eating nutritional food and obesity, then went on to make our recommendation. Eric’s background in Business came in handy, as we gave various recommendations that made sense from an economics point of view (i.e. decrease the tax or cost of fruits and vegetables in obese regions, subsidize farmers to increase fruit and vegetable output, or push advertisements encouraging people to eat healthier).

As a slight aside to our main focus on Obesity across the US, we also found that Stress (we defined stress as a lack of leisure time (LPA) and a lack of sleep) was high in big cities. We noticed that not only were kidney problems slightly higher in bigger cities, but so were other ailments such as strokes and diabetes. We were able to link the connection between stress and diabetes with kidney problems (seen below), and further connect kidney problems with strokes. Unfortunately, due to the time constraints for the competition, we were not able to explore these connections much deeper. However, given more time, we definitely would have done so.

SLEEP.pngfigure_1.png

Mean comparison showing increase in lack of sleep in big cities and scatterplot showing the relationship between sleep deprivation and kidney problems.

This competition was extremely fun to participate in. Unfortunately, we did not place in the top 3 teams for our section, although we did get an honorable mention. I want to thank GDMS and the CMDA club at VT for making this a reality. I’ve always been interested in data analytics due to my background in neural networks, and it was incredibly fun to work on something data analytics related even though I haven’t been able to take any statistics courses as of yet.

If you’d like to see any more plots, or would like to see the scripts I made for the purpose of this competition, feel free to email me at [email protected].

2017 Summer App Project – The Stalk Market

As my previous post (linked here) eluded, this is the second and main project I worked on during the latter half of my summer break from Virginia Tech. Described shortly, this project is a stock market tracker of sorts for the game Animal Crossing: New Leaf (ACNL) that is able to run from any handheld Android phone. My main focus for this project was introducing myself to the world of app development, mainly following various tutorials online and playing around with the Android Studio IDE. As such, the actual logic behind this project isn’t too difficult to grasp. As I’ll get into, the stock market in ACNL is rather simple and follows a strict set of rules. Thus, I mainly focused on making the user interface as fluid as possible, to ensure ease of use and practicality while keeping the function of the app in mind.

1

What the app looks like when you open it for the first time. I put a decent amount of effort into ensuring the app looks somewhat decent and is easy to use. Note, all pictures shown here are screenshots taken on my Google Pixel.

First, onto the basics of the stock market in ACNL. Every Sunday, the player can buy Turnips from a particular NPC that visits the town. The price for that particular set of turnips can range anywhere from 90-110 bells (the currency of ACNL). Then, throughout the week, the selling price of those turnips changes depending on the particular pattern for that week. The prices change twice per day (at store-open and 12pm), with the turnips rotting at exactly 6am on Sunday. Thus, the player must guess when he or she should sell all of the turnips they purchased for that week to ensure maximum profits. This is where my app comes in. The user is to enter every price update in-game into the app. Then, when prices are optimal, the app recommends the user to sell all of their turnips.

There are 4 patterns the stalk market can have for any given week, each with its own set of rules that makes it easily distinguishable from the others. Of the patterns that produce positive returns, the player is first tempted multiple times with above average selling prices before the maximum price is observed. The biggest example of this is the big spike pattern, where there are 2 above average prices before the best price, often double that of the previous prices, is observed. My app guesses which pattern is most likely for the given week/set of values, and warns against selling your turnips until it thinks the highest value for the week has been achieved. There is only one pattern in which the player is guaranteed a loss. If you’d like to read more on the various patterns and their strategies, I would recommend visiting this page.

2    3

Though the turnip price in the first picture is much higher than the purchase price (labeled in blue), the app recommends waiting, which pays off with a week-high price 3 times that of the previously shown price, as shown in the second picture.

Once the logic was finished and patted down, I moved onto the user interface portion of the app. The only non-native library I used was GraphView for the plot of prices seen on the upper-half of the screen. The main challenge when coming up with the UI for this project was where to place the buttons and text box in relation to each other and the graph. I ended up with the current design, as I think it looks and feels simple and easy to use. One of the previous designs had all of the buttons underneath the graph in a 2×2 grid pattern, which failed due to the strangeness of fingers as a cursor. Sometimes, I found myself pressing the bottom right button when I meant to press the upper left button, among other similar problems. I’ve found that the current vertical design is a clear and easy solution that wasn’t difficult to implement. Other than button placement, I used in-game and fan art (the background, turnip, and animal figure) for decorating the app. If I were to publish this on the Play Store, I would first want to draw myself or enlist the help of a friend to redraw all of these assets to ensure I didn’t steal content from their creators. As such, you will not be able to find this on the Play Store as of yet. However, if you email me saying you want to put this app to use, feel free to and I will post an app that falls within these guidelines.

This project was fun to explore. I learned a whole lot about Android app development, and created something I can put to use in my future ACNL endeavors. If you’d like to look at the source code, you can see it here.


2017 Summer Cryptography Project – Caesar Ciphers and ASCII Tables

Admittedly, the time before my summer semester in Japan was ill-spent in regards to furthering my understanding in the Computer Science world. However, there were still a couple of projects that I did for fun before I left. This first project, a rather simple caesar cipher, was the first of two projects I did. I did this project in particular as a way to brush up on some of the knowledge of the C language I gained during my spring semester CS 2505 class at Virginia Tech. For those unfamiliar with the concept of a caesar cipher, it’s a crude way to encode a chunk of information — simply taking every letter and shifting it up or down a predetermined number of spaces in the alphabet. For instance, the string “abcd” would be encrypted to “bcde” with a caesar key of positive one. Of course, traditionally, wrapping occurs at the ends of the alphabet; meaning z -> a with a key of +1, and a -> z with a key of -1.

There are a couple key parts when it comes to translating this into code. First and foremost, I made it runnable via. the command line. The program expects the file path to the text file the user wants scrambled or unscrambled, along with either ‘e’ or ‘d’ for ‘encode’ and ‘decode’ respectively. Next, instead of letting the letters wrap once at the end/beginning of the alphabet, I allowed the characters to go above/below this limit, possible thanks to the format of the ASCII table.

asciifull

ASCII table

In C, along with the vast majority of programming languages used today, ‘char’ (character) variables are actually stored as integers. Each character is 1 byte, allowing for up to 256 different characters to exist. This not only includes your standard upper/lower case alphabet and numbers, but also special characters, along with some special, machine only characters, like ‘\n’ (new line). So, instead of wrapping at the ends of the alphabet, I wrapped at the ends of the ASCII table (see methods encode and decode in the block below to see how). In regards to my program, this is relevant because it allows for characters to spill over into generally weird or unexpected characters, making it easier on us to program because we don’t need to look for specific ASCII values to wrap around, as well as adding a bit more effectiveness to the final product. Of course, this method won’t fool someone who knows what they’re doing when it comes to decryption, but it should generally prevent friends or co-workers from snooping into information you don’t want shared.

There are still plenty of improvements that can be made to this system to improve it even further and lessen the chance of someone cracking a particular files key. As you can see in this iteration of the program below, the key is static between all files, meaning a correct guess on one file means access to your entire library of secret text files. This could be improved by simply making the key random between files and stored somewhere inconspicuous. For instance, the key could be between 0 and 255, and simply written as the first character of the encoded file. While again, this method would fail almost instantly in the case of a professional crack, it should stump the average Joe for a couple of hours. Or, perhaps this method is repeated for every character in any one file; the key for any given character placed just before or after it. I’m sure you can see how this method can become increasingly complex, and increasingly difficult to break, the longer you think about it.

FILE *f;

int caesar = 5;

int main(int argc, char **argv) {
	if (argc != 3)
		badInput();
	FILE* f = getFile(argv[1]);
	if (strcmp(argv[2], "e") == 0)
		encode(f);
	else if (strcmp(argv[2], "d") == 0)
		decode(f);
	else
		badInput();
	fclose(f);
	return 0;
}

void badInput() {
	printf("Format is '.../caeser <.../fileToEdit.txt> <e/d>'\n");
	exit(1);
}

FILE* getFile(char *url) {
	FILE *f = fopen(url, "r+");
	if (f == NULL) {
		printf("Can't locate file '%s'", url);
		badInput();
	}
	return f;
}

void encode(FILE *f) {
	int c;
	while((c = fgetc(f)) != EOF) {
		fseek(f, -1, SEEK_CUR);
		fputc((c + caesar) % 255, f);
		fseek(f, 0, SEEK_CUR);
	}
}

void decode(FILE *f) {
	int c;
	while((c = fgetc(f)) != EOF) {
		fseek(f, -1, SEEK_CUR);
		fputc((c - caesar) % 255, f);
		fseek(f, 0, SEEK_CUR);
	}
}

The C code behind the Caesar Cipher. If you have any questions about the code feel free to email me: [email protected].

This project was an easy, quick, and fun way to stay familiar with the ins and outs of ASCII values and C I/O alike. Feel free to take this idea further and create ciphers of your own!

© 2024 Brendan McCloskey

Theme by Anders NorénUp ↑